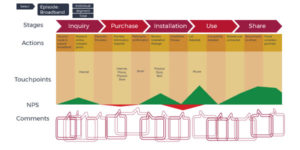
As the world of CX matures, so does our use of tools and data. The humble Customer Journey Map – for so long the province of workshops and post-it notes – is a great example.
These workshops can undoubtedly bring value by developing a shared understanding of a customer’s journey with your brand – especially if care has been taken to involve real customers. There is also value in seeing the end-to-end (intended & unintended) contributions of internal functions that are not often visible. However, what happens to the accumulated corporate memory beyond the workshop day? Does it just walk out the door? There is, no doubt, some level of follow-up documentation – even beautifully produced graphics – but the point is that, the Customer Journey Map is a static view assembled in one workshop day.
When it can (& will) be so much more.
I can see a day when the Customer Journey Map becomes dynamic – and the dominant “frame” through which CX programs are measured and acted upon. The “Shift to Customer Journey Insights” (Bruce Temkin) is already being talked about.
The fundamental reasons for this are already established in the static CJM world:
- Customers may be encouraged by the improvement of a Contact Centre interaction (a “touchpoint”) but are far more impressed at being able to achieve what they set out to do (an “episode” or “job to be done”).
- Collaboration and co-operation across different internal business functions is greatly enabled by a visual appreciation of the end-to-end journey
However, what happens when we make CJM dynamic? What happens when we “digitise” the CJM view, integrate real-time data feeds (e.g. NPS ratings and verbatim analysis) and allow for different “treatments” of customer episodes.
This opens up a world of possibilities:
- Real-time NPS data allows a visual representation of what touchpoints matter within an episode; and more importantly, which episodes matter to Brand NPS & sales growth; i.e. a very quick fix on “measuring what matters”
- With some careful design, the personas usually incorporated in CJM should reflect meaningful segments that can be used to drill down on. So, for example, what does this insurance claim episode look like for females over 50 with incomes of x.
- Similarly, just about any meaningful attribute from store/branch location, to time of day or day of week, to transaction value to channel used – should be available as a way of investigating the data. Not as an analysts tool – but as a way for a broad base of end-users to interrogate data in a visual way that is familiar to them (& customers!)
- And what about some A/B testing – some “test & learn”. Let’s take one cohort of customers and treat them differently (add, remove or adjust a process), examine against a baseline and make adjustments.
I don’t wish to trivialise the challenges in setting up such a regime. There are some fundamental design & data issues that need to be addressed not the least of which are:
- Agreeing a clear definition of what qualifies as an episode and where it starts and finishes
- Enabling the data to support all aspects of the CJM view
- Incorporating the tools to reconfigure the CJM view
However, as proponents of current CJM initiatives will attest – this view of the world brings data to life and drives employee collaboration even with a static view. Establish some dynamic views and watch this drive-up CX programs to the next level!


